Humanizing insight delivery with data storytelling in BI platforms

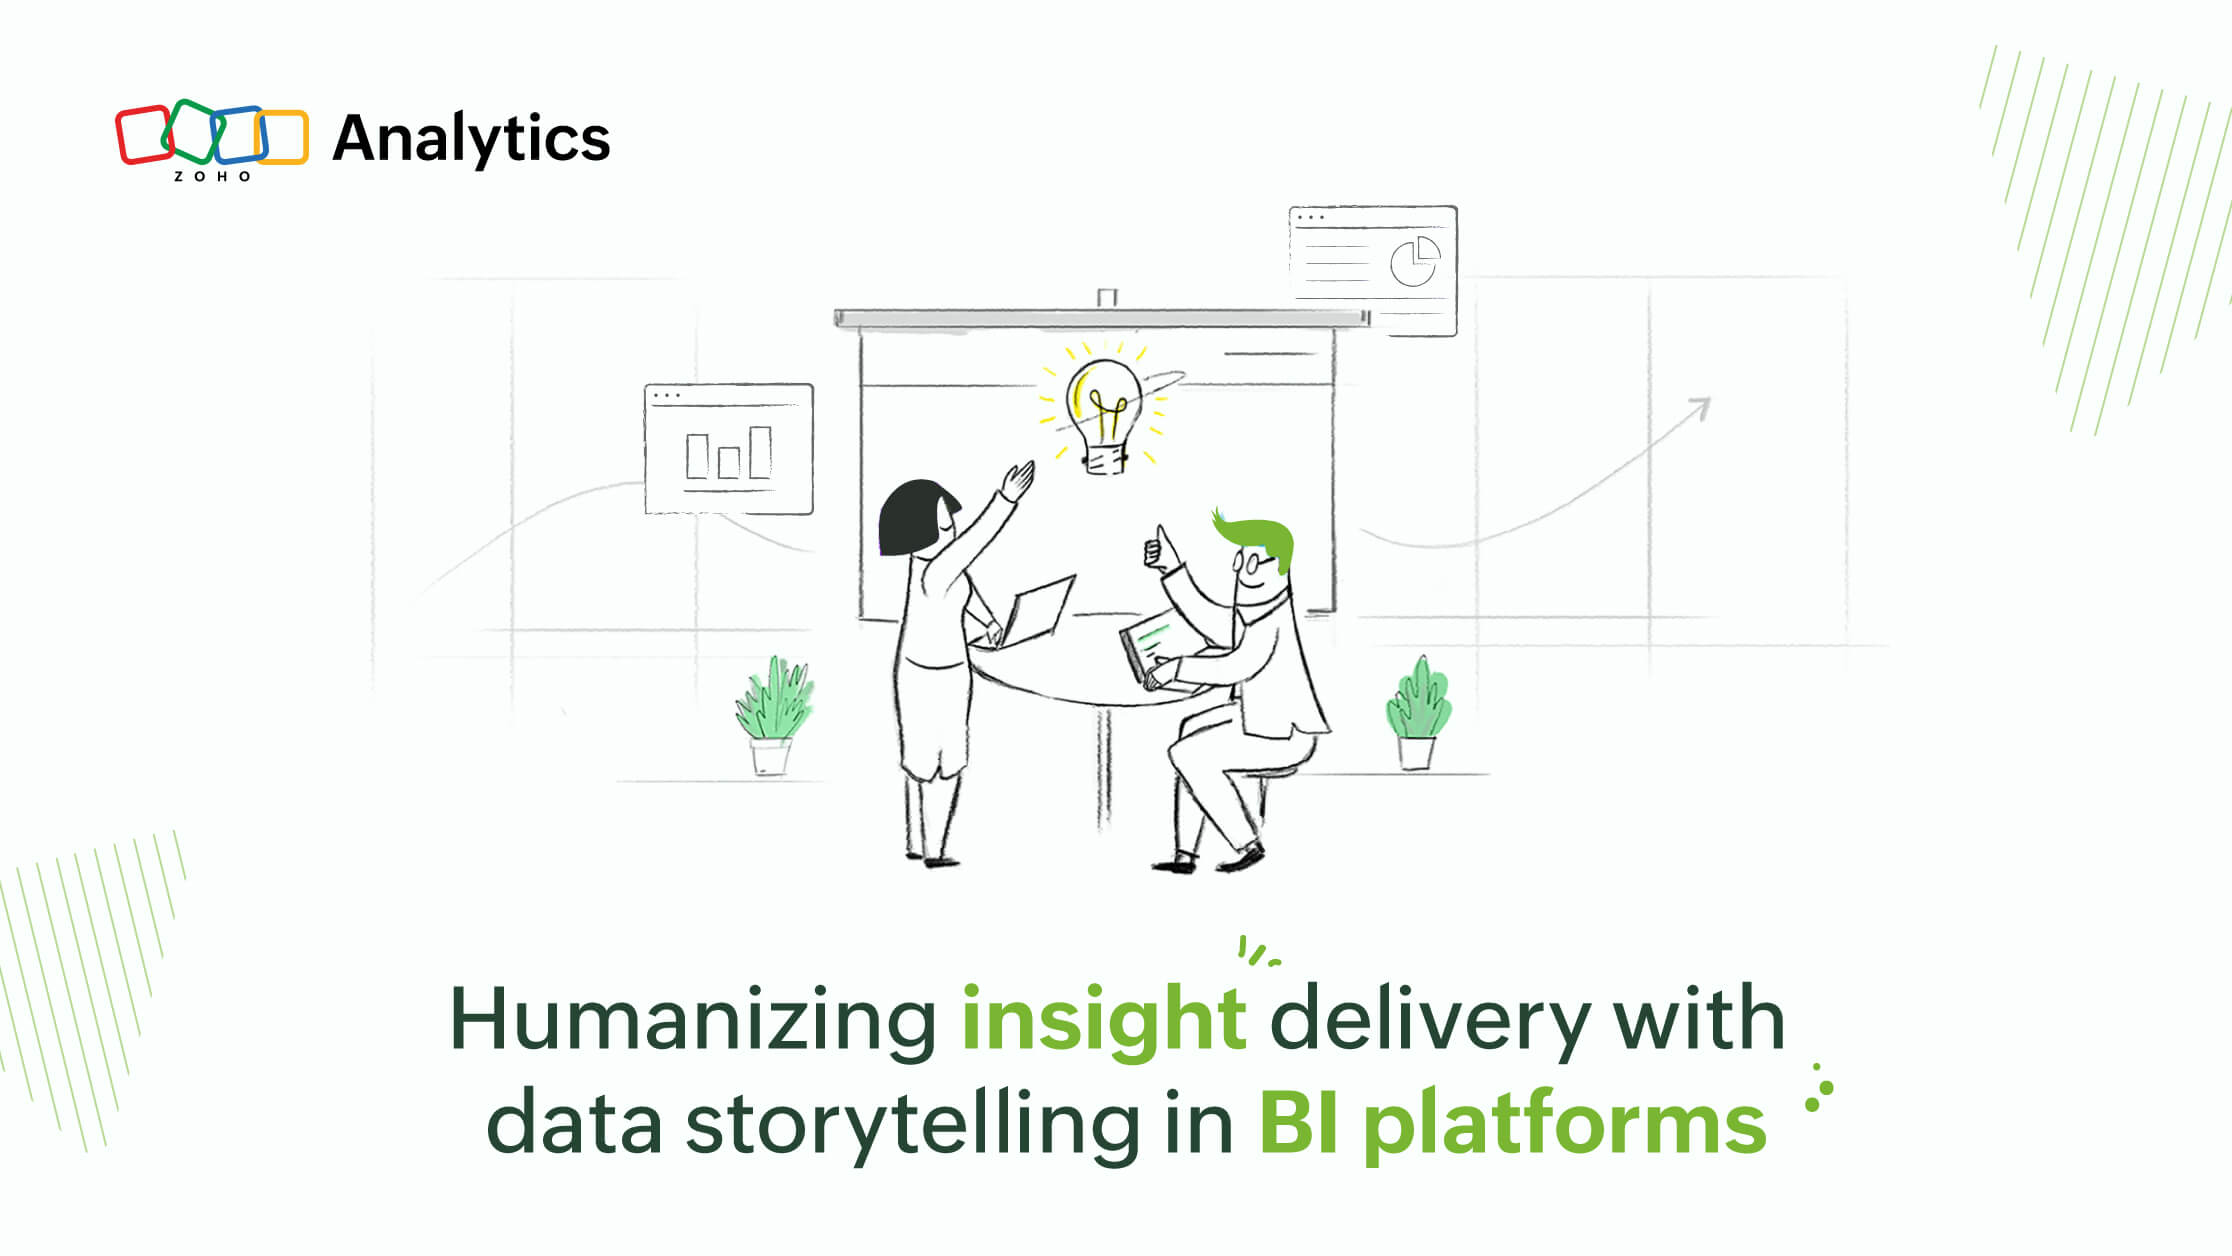
BI and analytics today extends beyond crunching numbers to deliver business insights, covering every aspect of a user's analytics experience. In that context, users are now looking for more consumerized experiences when interacting with data and insights. This has led to the emergence of creative communication powered by data storytelling.
In this blog, we'll discuss a data storytelling model that can guide BI users in crafting good data stories. We'll also look at a couple of key data storytelling tools that can help BI users present their insights with more context and empathy.
4 pillars of effective data storytelling
These 4 pillars outline the four attributes of good data storytelling that can help BI users craft compelling data stories to improve decision-making. In the following segment, we'll dive deep into these 4 pillars—self-service, live & interactive, creative, and data governance.

1) Self-service
By self-service, we mean to empower BI users to craft and present insights in the form of compelling data stories all by themselves. This speeds up the process of decision-making. One way of bringing this about is with platforms powered by low-code/no-code capabilities.
2) Live & interactive
The rigidity of traditional static reports hinders users from being able to access updated information, do ad-hoc analysis, and freely interact with data insights. These challenges can be addressed with live and interactive data stories that ensure the insights stay automatically updated. Users can also freely interact with insights using dynamic drill downs, filters, and so on.
3) Creative
Creativity in data storytelling allows users to communicate complex data insights in an engaging and compelling way. By paying attention to the layout, color scheme, and other design elements, users can make data stories more accessible and consumable. BI platforms today equip users with a range of tools and elements to facilitate creativity in insight delivery.
4) Data governance
While we may have a great data story in hand, it's important to ensure the integrity of the information presented. Data governance provides an effective framework for how data is collected, managed, and used in modern BI platforms. It also enables users to define fine-grained access controls to ensure who uses the insights and how. We'll look at this in more detail in the upcoming sections of this blog.
Key enablers of data storytelling in modern BI platforms
As data becomes more ubiquitous, data storytelling will continue to play an increasingly important role in enabling businesses to extract value from data. Addressing the needs of the time, BI platforms are beginning to introduce data storytelling capabilities natively within BI workflows.
Here are a couple of rapidly emerging data storytelling capabilities in the BI market:
1) Presentations
Presentations are a powerful tool for business communication, allowing information to be conveyed with engaging visual aids. With extensive presentation capabilities now being supported within BI platforms, users can seamlessly include interactive data insights as part of their daily presentations. Most of the heavy lifting—done in terms of copying iframes, embedding code, and much more—is eliminated this way.
In the demo video below, we have briefly covered how you can create a presentation from within Zoho Analytics, add various creative elements that are available in the presentation builder, set up access controls, and a lot more.
To explore this capability in more detail, you can check out our complete webinar.
2) Analytics portals
Purpose-built analytics portals are another great way of presenting and consuming insights. Analytics portals allow data stories to be presented in a self-explanatory manner that can be securely accessed by users. These portals can have multiple tabs, embedded videos, iframes, maps, images, or any other media files, and a range of creative elements that make data stories engaging and compelling.
In the demo video below, you can check out some key capabilities of an analytics portal built using Zoho Analytics.
Conclusion
With the rapid adoption of BI and data analytics across the world, it's becoming increasingly important that BI users learn to craft and deliver immersive data stories, as they play a crucial role in decision-making today. These 4 pillars of data storytelling can be used as a guide to create effective data stories.
By bringing in capabilities that implement this model in action, modern BI platforms are marching towards a new milestone in data storytelling. We foresee interesting updates in the data storytelling space in 2023.
Watch our complete webinar on data storytelling to learn about these capabilities in more detail.
Sign up for Zoho Analytics today, or schedule a free personalized demo with one of our experts!


Comments