Zoho Analytics Now Connects to Tally Prime

Most finance teams have two systems. The one where the numbers live, and the one where the numbers get understood. Tally Prime handles the first job well. It's where transactions are recorded, ledgers maintained, vouchers logged. It's accurate, structured, and complete.
The second job falls to Excel.
Every week, someone exports a report from Tally, pastes it into a spreadsheet, builds a chart, and sends a file. The next week, they do it again. The spreadsheet is always slightly out of date. The chart looks right but needs to be rebuilt whenever the date range changes. Nobody is sure if the version they're looking at is the latest one.
This is a structural problem. Tally wasn't built to be a reporting layer, and Excel wasn't built to stay in sync with accounting software. Connecting them manually, repeatedly, by hand, is the gap that most finance teams have learned to live with.
What a connected system actually looks like

When Tally Prime connects to Zoho Analytics, that gap closes. Your ledger data, voucher registers, stock summaries, trial balance, purchase orders, and closing stock sync directly into Zoho Analytics on a schedule you set. The export step disappears. So does the reformatting step, the chart-rebuilding step, and the file-sharing step.
What you're left with is a reporting layer that stays current without anyone maintaining it. Cash inflow and outflow as live KPIs. Trial balance by accounts, debit and credit plotted side by side, updated every time Tally syncs. Revenue broken out by sales, credit notes, and debit notes across months. Inventory by item, rate, and value. Profitability by category. All of it built once, kept current automatically.
Here's a sample dashboard for better understanding:
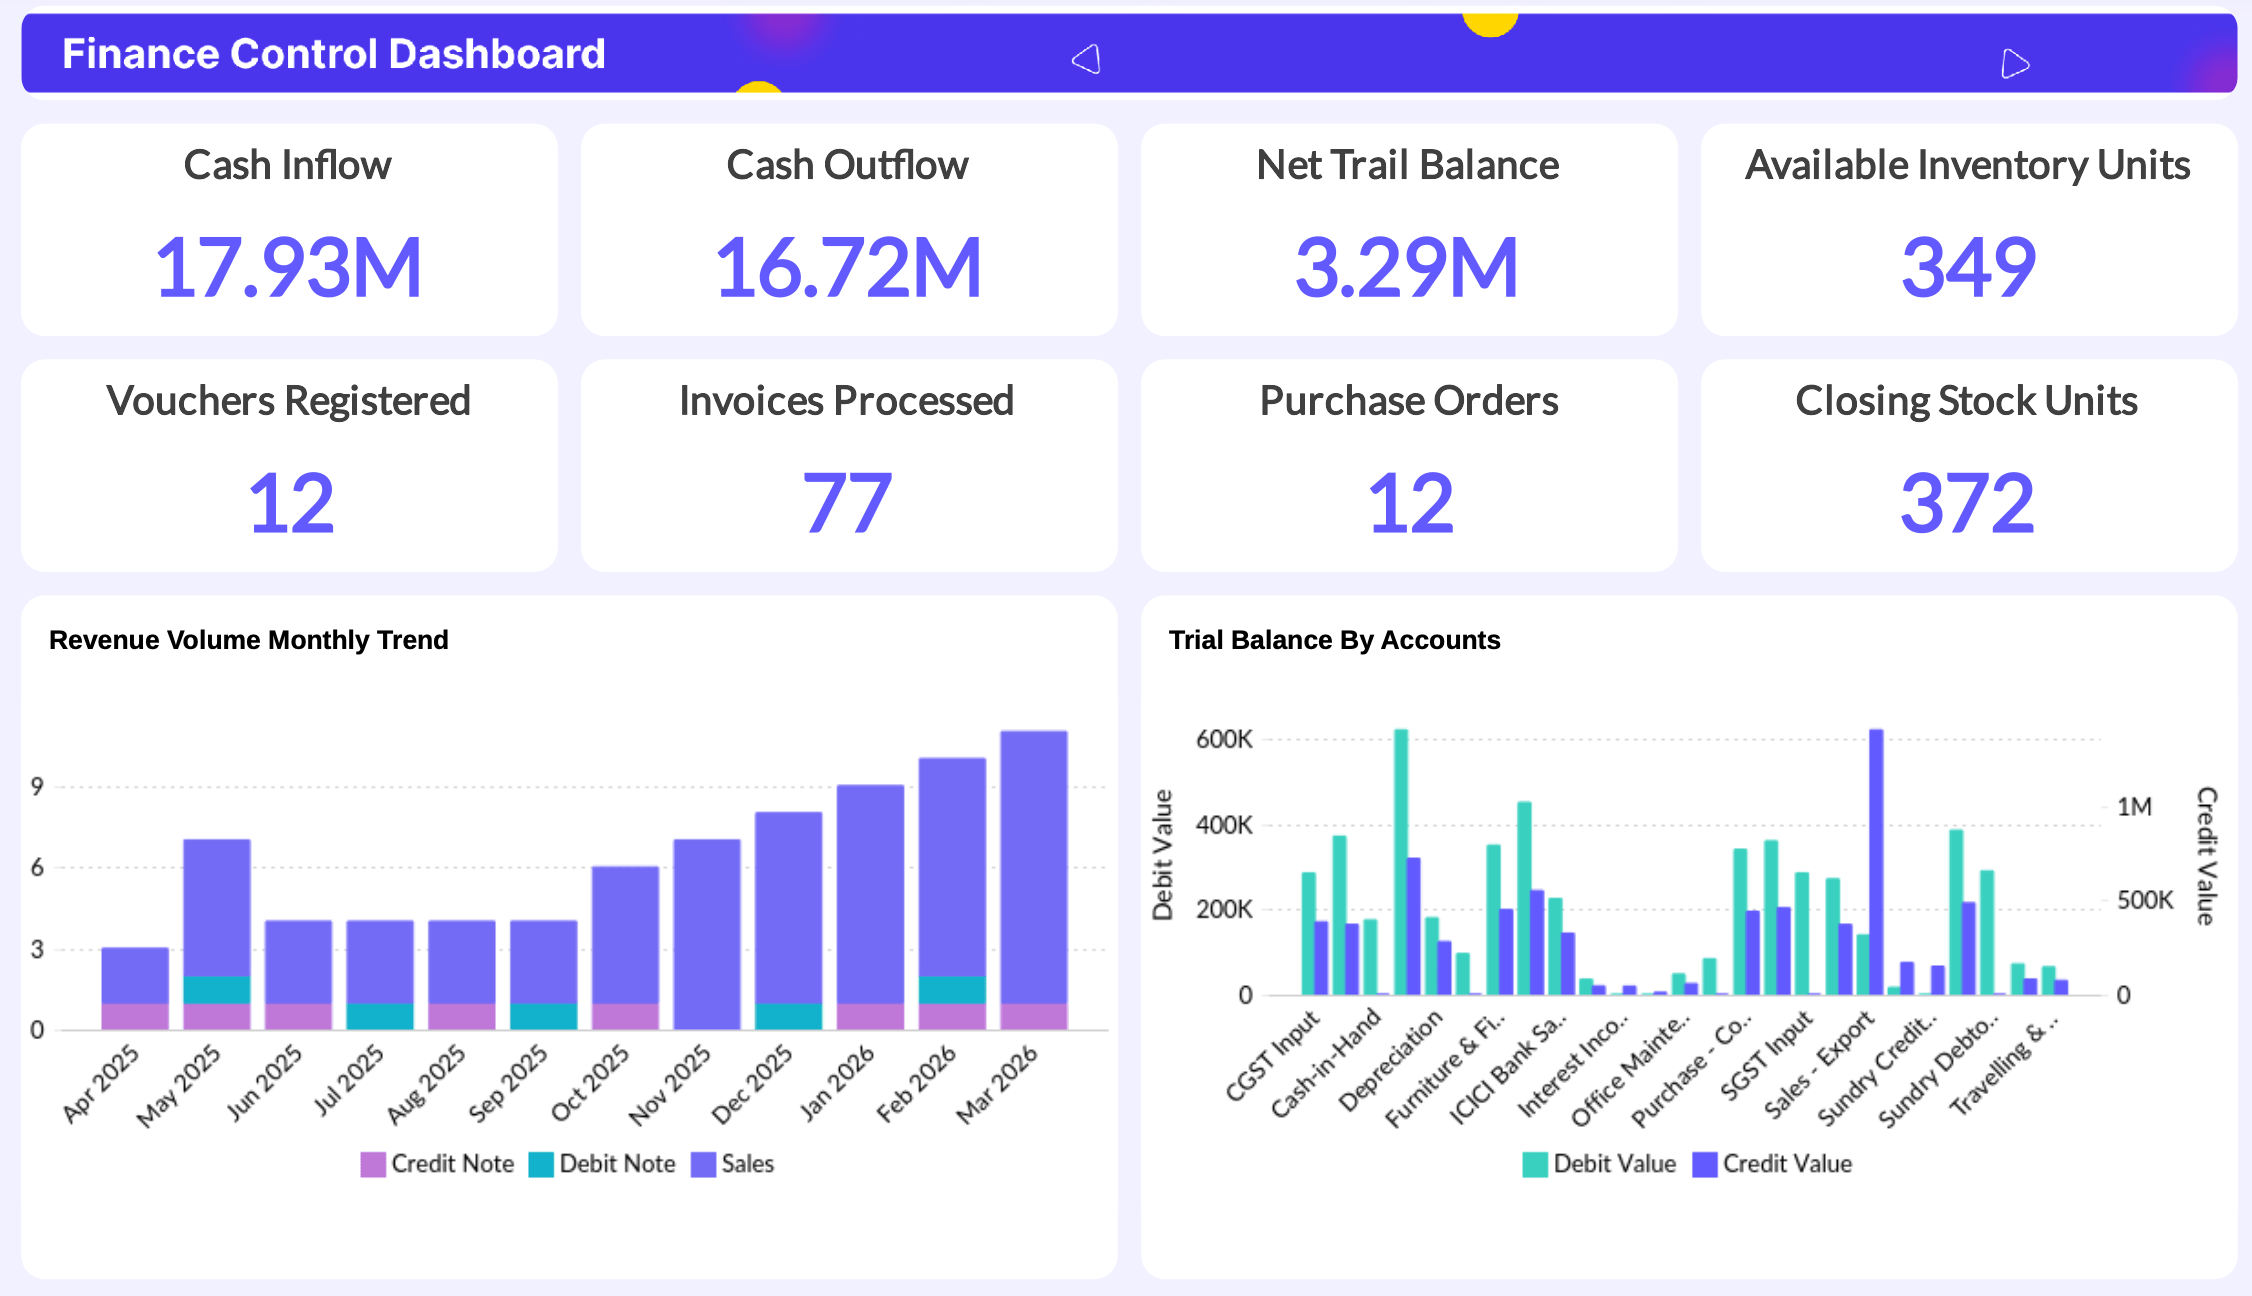
The reports that finance teams rebuild every month become dashboards they check every morning.
The part that changes how you work with the numbers
Connecting data is the baseline. The more interesting shift is what becomes possible once the data is in one place.
The drag-and-drop report builder means anyone on the finance team can create a chart without waiting for a data analyst. Ask Zia goes further: you type a question in plain English, "what were my top expense categories last quarter," and it builds the report.
Zia Insights reads your existing reports and pulls out what's worth paying attention to, the patterns and anomalies that would otherwise require someone to stare at the numbers long enough to notice them. Diagnostic insights go a step further, surfacing reasons behind the trends and flagging what to look at next.
Who feels this most?
The finance teams this matters to most are the ones where one or two people are responsible for both the accounting and the reporting. They know Tally well. They've built the Excel templates. They're the ones doing the exports every week, and they're also the ones who would most benefit from not doing them.
For teams already on Zoho Analytics, the connector means Tally data can sit alongside CRM data, inventory data, or anything else already in the workspace. A view that joins revenue from Tally with pipeline data from your CRM stops being a one-off project and becomes a standing report.
The practical part
Connect Tally Prime with Zoho Analytics, select the modules you want to import, and set a sync frequency. If you're not on Zoho Analytics yet, a 15-day free trial gives you full access to set up the connector and build your first dashboard on your own Tally data.


Comments