Make the most of Zoho Sign with the new Usage dashboard

Picture a typical admin at a mid-sized company. They rolled out Zoho Sign eight months ago, onboarding went smoothly, and now documents get signed without issue.
But the admin is never quite sure how to make the most of the platform. A recent feature could have saved their team an hour every week, but unless someone happens to mention it during a support call or they stumble across a release note, they'd never know. Multiply that across every admin managing Zoho Sign, and that's a lot of untapped potential.
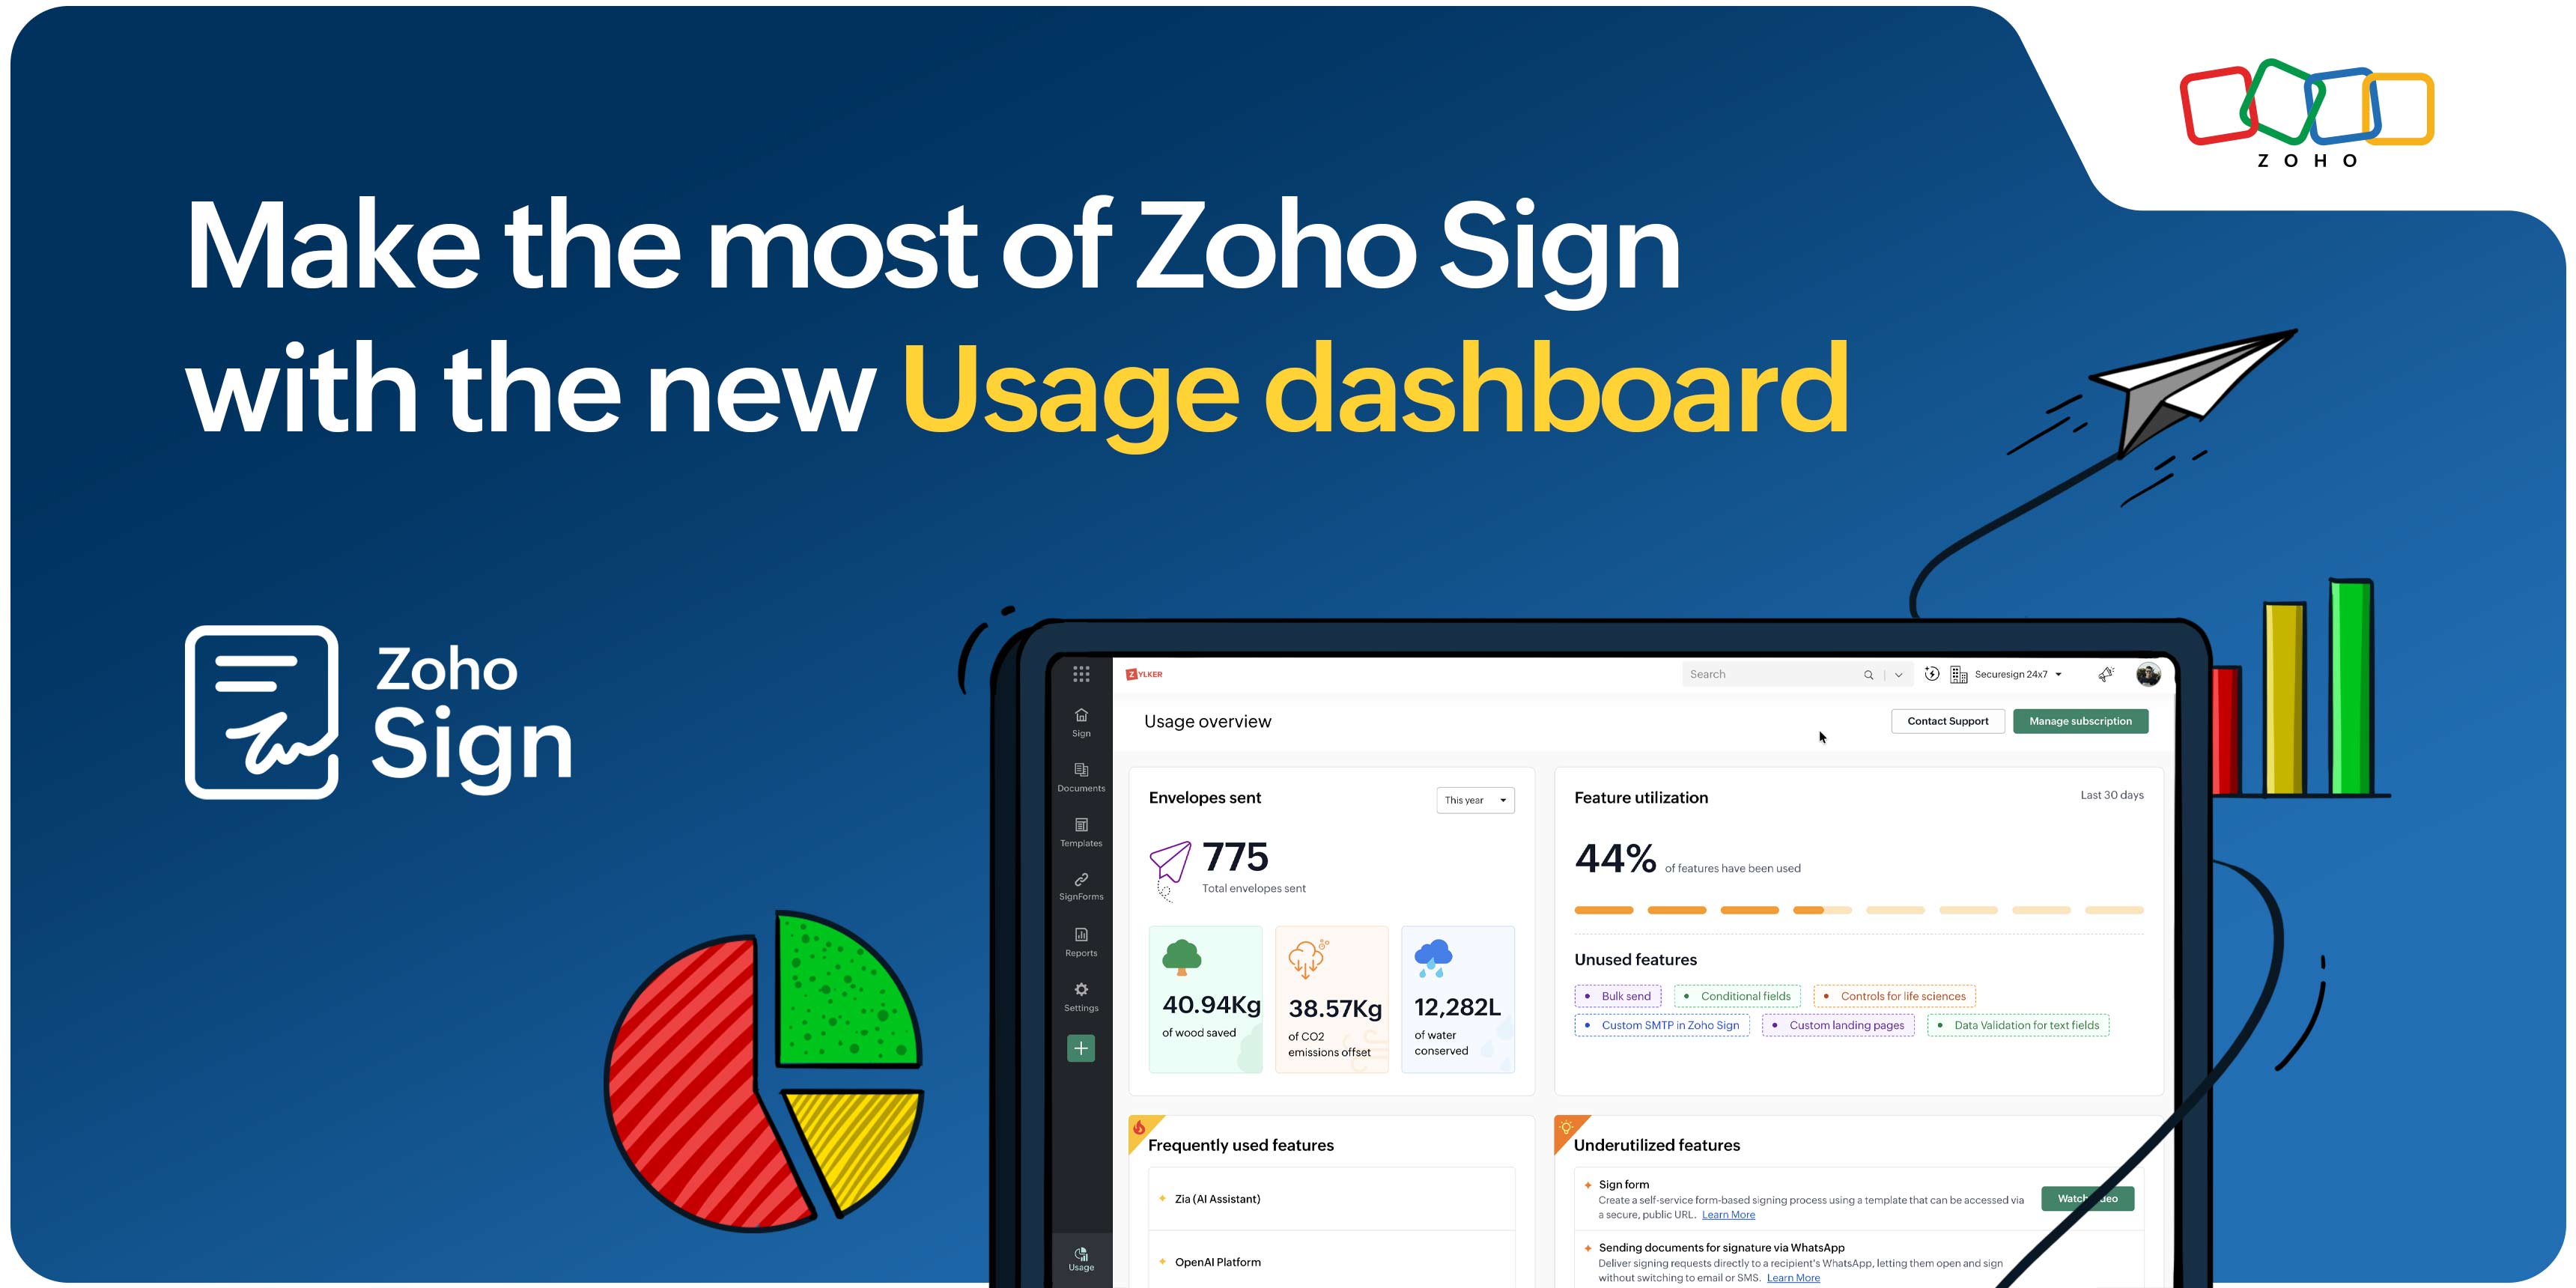
That's what the new Usage dashboard is designed to address. Available on all plans and across every data center, it gives organization administrators a single view of how their teams use Zoho Sign: how many envelopes they're sending, which features they're using, and what their overall app usage looks like. Instead of relying on assumptions about how your team signs documents, you get a clear picture of what's actually happening.
Here's what's inside.
Envelopes sent for signing
The Envelopes sent panel tracks how many envelopes your organization has sent this year compared with last year, side by side. It's the simplest number on the dashboard, but often the most telling; it shows whether your team is truly using the platform or whether adoption has plateaued somewhere short of where it could be. If the year-over-year number is climbing, that's confirmation that your rollout is working. If it's flat, that's worth digging into.
Real-world environmental impact
Right below that panel, three tiles translate your envelope volume into wood saved, CO2 emissions offset, and water conserved. The calculations are based on real-world paper production figures: one kilogram of paper corresponds to roughly 200 sheets, generates about 0.942 kg of CO2 during production, and consumes close to 324 liters of water. Wood savings are calculated using the standard ratio of 25 to 40 sheets per kilogram for the eucalyptus and pine typically used in A4 paper.
Multiply those savings across an organization's envelope volume, and the impact becomes more meaningful. It's information you can share with leadership or include in a sustainability report without having to do the calculations yourself.
How your team actually uses Zoho Sign
The Feature utilization panel shows what percentage of Zoho Sign's features your team has used in the last 30 days. Just as importantly, it lists every feature included in your plan that hasn't been used during that period. Each feature is clickable and links directly to its help article.
This is the number that often surprises people. Teams that feel like they know the product well are often using a smaller portion of its capabilities than they realize, simply because new features can be added faster than teams can discover and start using them. If that percentage is lower than expected, the list of unused features tells you exactly where to begin.
What your team leans on the most
The Frequently used features panel ranks the features your users rely on most, based on activity over the last 30 days. That means no surveys, guesswork, or relying on whoever happens to be the loudest voice in a feedback call. Just a view of what people are actually using day to day. It's a useful sanity check, too. If a feature you introduced to your team with a lot of excitement isn't showing up here, it's a sign that adoption may not be where you expected it to be.
What your team uses the least
At the other end of the spectrum, the Underutilized features panel lists features included in your plan that haven't been fully adopted. Each feature comes with a brief description and either a Watch Video button or a Learn More link to the relevant help article. If something on the list looks useful, you're one click away from learning more instead of having to hunt through documentation. It's worth checking periodically; there's a good chance something on the list could fit a workflow your team is still handling manually today.
Regional features to consider
The Popular in your region panel shows the features that Zoho Sign customers in your country have used most often, based on your data center and all-time usage patterns.
Usage can vary by geography because of differences in compliance requirements, signing practices, and preferred authentication methods. If your team hasn't tried a feature that's popular among customers in your region, it's a useful signal that the feature may be worth exploring, particularly if it addresses a regional requirement you weren't aware of.
Zoho Sign releases
Finally, you'll find a running list of recent Zoho Sign releases, each tagged with the edition it's available in. Product updates ship often enough that it's easy to lose track of what's new. It's even easier to miss that a feature you could benefit from is already included in your current plan and simply hasn't been used yet. It’s an easy way to stay up to date on what’s new without having to comb through release notes or ask around.
How to access the Usage dashboard
Admins can find the dashboard under Usage in the left navigation pane. It opens to the Usage overview, which provides a consolidated view of your team's activity.
On a brand-new account, most panels will show empty or near-zero values until you send your first envelope and allow a few minutes for the dashboard to update.
Put together, the dashboard turns "are we using Zoho Sign well?" from a guess into an actual answer, backed by your own organization's data.
Ready to see where your team stands? Head to Usage in the left navigation pane and pull up your dashboard. If you're not already a Zoho Sign customer, head over to zoho.com/sign and sign up for a 14-day free trial.
Please feel free to email us at support@zohosign.com to share your feedback or ask us anything about what you find on your dashboard.
Until next time, happy signing!
Comments